Box Plot
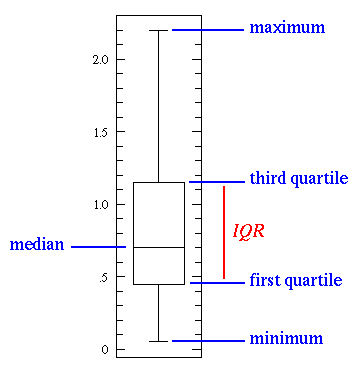
A box plot is a way of presenting the distribution or variability of a topic. It shows where the median, Q1, Q3, minimum, and maximun are and the Interquartile range (IQR).
A box plot is a way of presenting the distribution or variability of a topic. It shows where the median, Q1, Q3, minimum, and maximun are and the Interquartile range (IQR).