Dot Plot
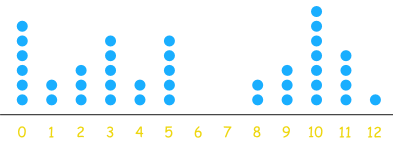
A dot plot is a way to present numerical data. A dot plot is a number line with dot placed on it corresponding to their value. The intervals between each number stays the same.
A dot plot is a way to present numerical data. A dot plot is a number line with dot placed on it corresponding to their value. The intervals between each number stays the same.